
UE4 Optimization Basics (4.23)
In this post, I am going to briefly go over the process of optimizing and increasing the playable framerate for our interactive experience, Subaqua. This was written using Unreal Engine 4.20.
Cheatsheet
Console Commands
Stat FPS: Show frames per second on screen
Stat Unit: Show timings for game, draw, and GPU
Stat SceneRendering: See the number of draw calls and other counters
Dumpticks: See all the actors currently ticking
Stat StartFile / Stat StopFile: Start and stop running the CPU profiler
ShowFlag.<AssetType> 0: Sets the visibility flag of the given assert type to off. (StaticMeshes, SkeletalMeshes, Particles, Lighting, Translucency, etc)
Stat None: Clear all
Shortcuts
Ctrl Shift Comma: Run GPU profiler for one frame
Windows
Statistics: gives a quick overview of what assets are utilized most, to see where the biggest potential performance impact will be
Session Frontend: Allows you to load and analyze and CPU profilers that have been run
In Practice
Our project was in a unique situation, developing on a single screen and deploying using nDisplay across 6 projectors. This meant that any profiling in the editor was going to be inherently different from the games’ deployment platform. However, I think it was always clear that we were going to be GPU bound as we were pushing high-resolution and 2-4k textures, with limited blueprint complexity.
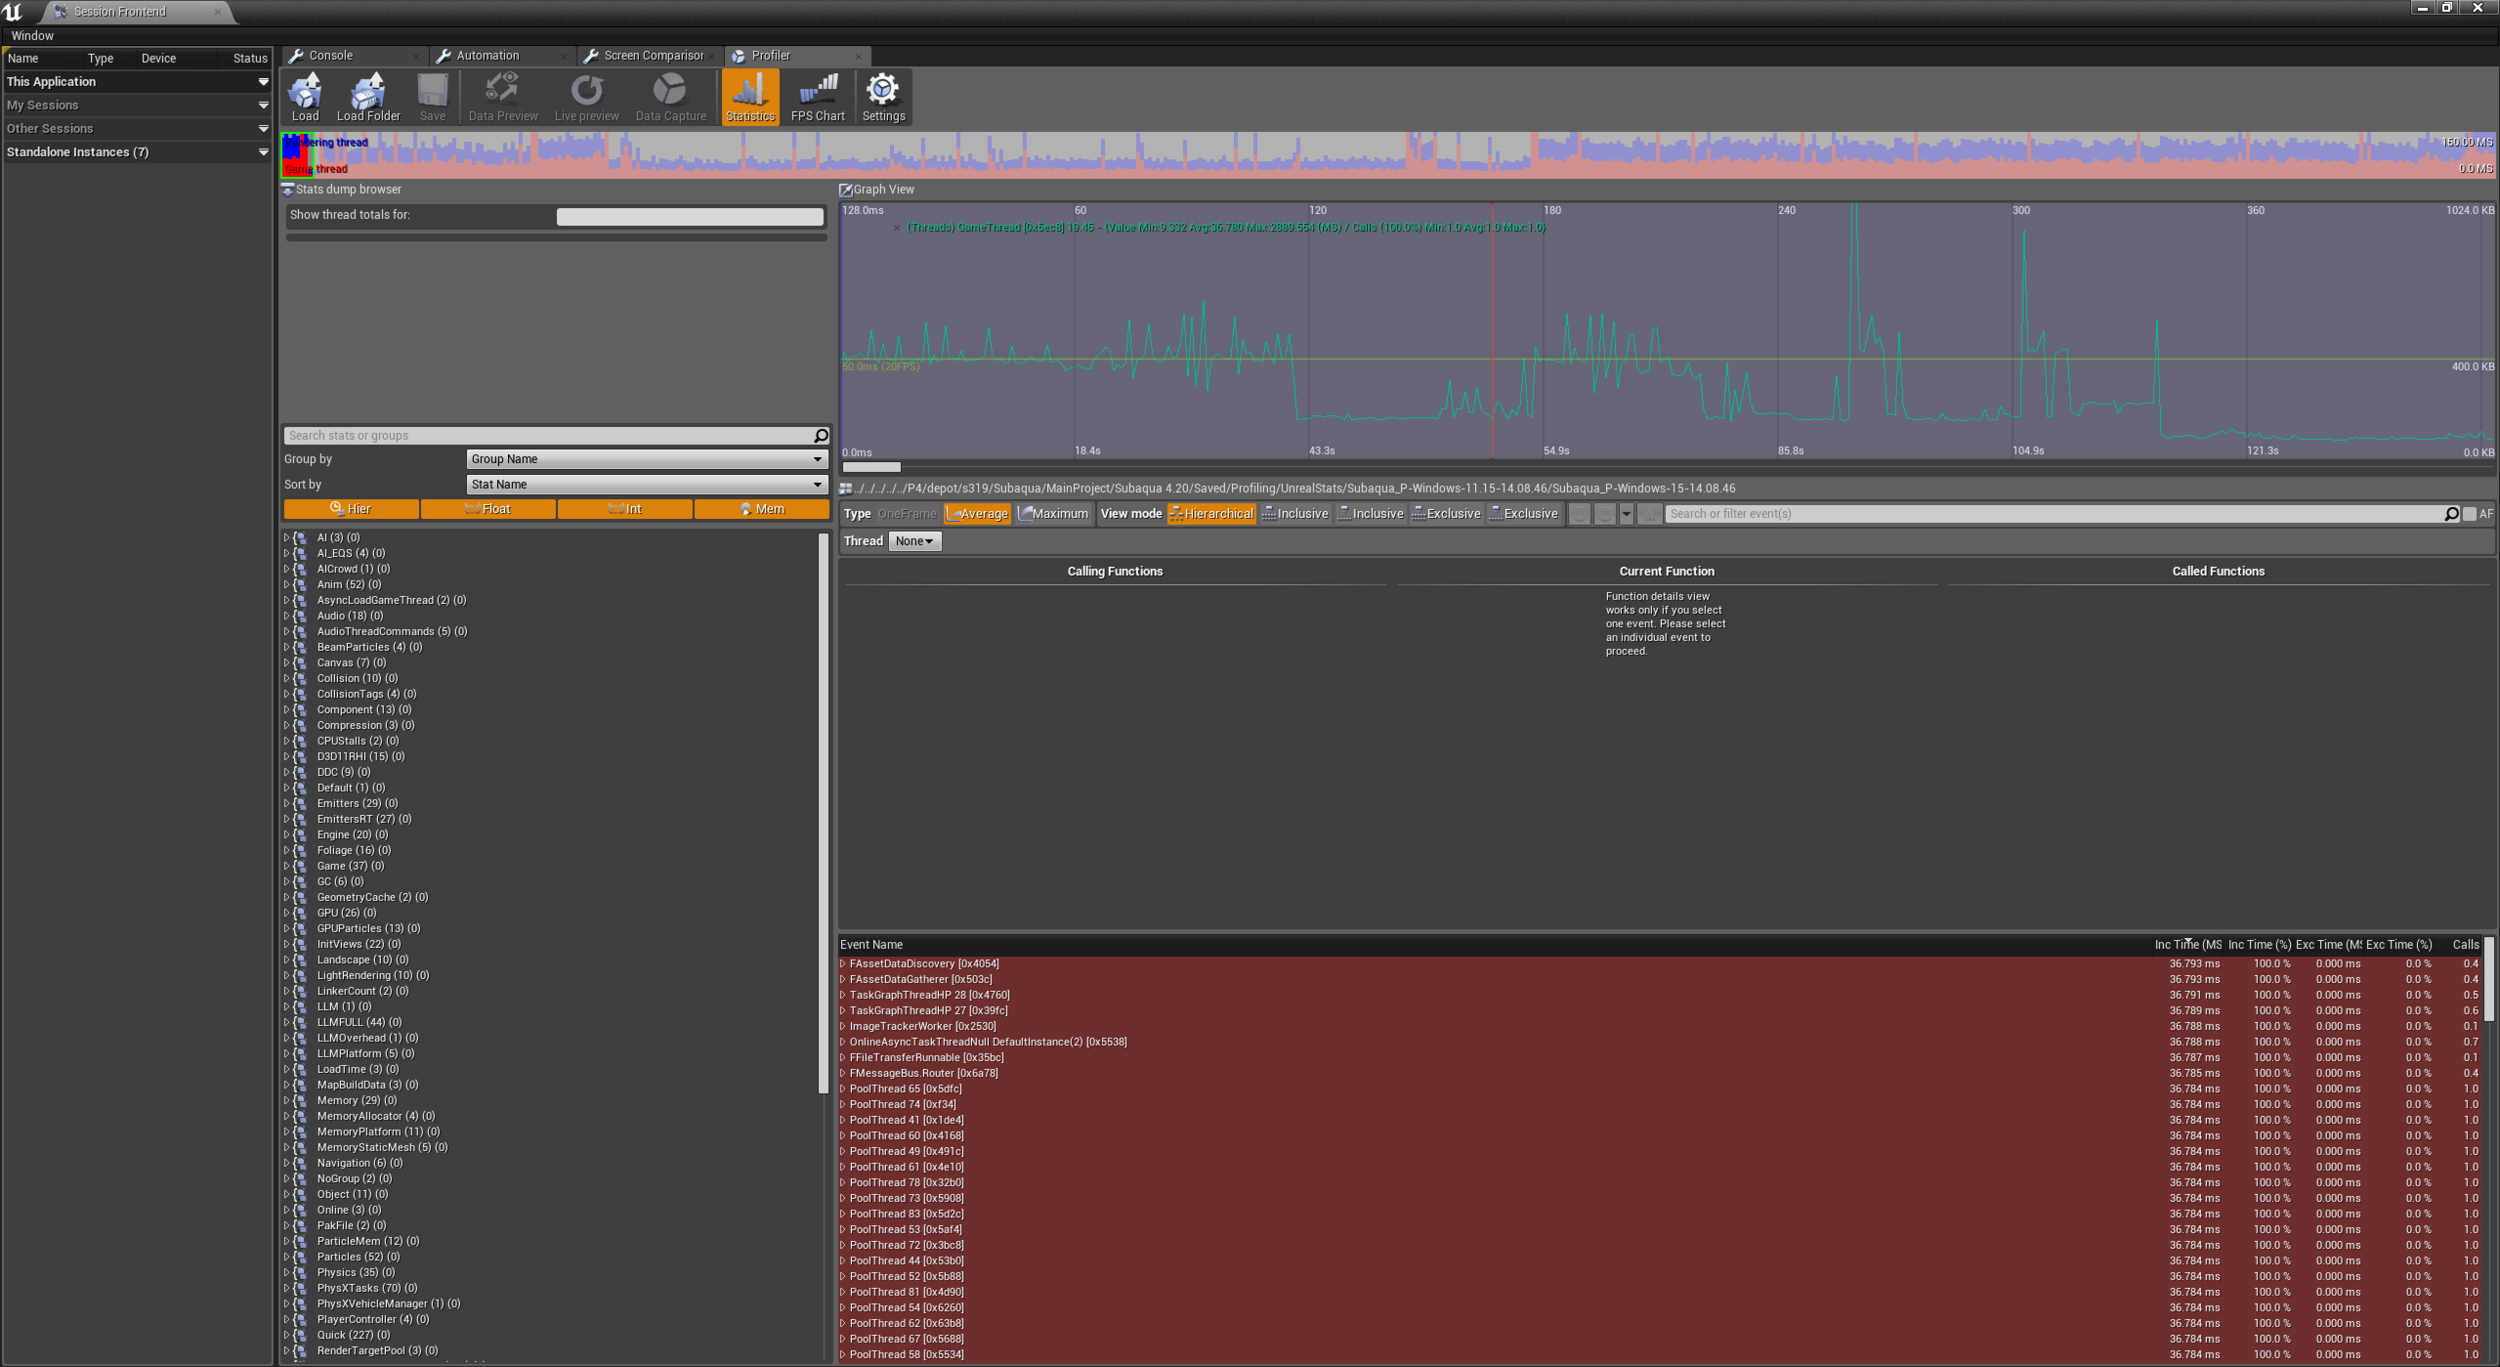
First run of the CPU Profiler
The first step was to run a CPU profiler for the duration of the experience. This gave us a benchmark for performance, and where the most problematic areas were. It was clear from this graph that the start and end levels took the most time, whilst the middle section was relatively performant. This was expected, as the first and last sections were wide open with a high-resolution ground plane, and the middle section was a narrow cave, with less density of assets. We also noticed periodic hitching, however, this was reduced by turning off framerate smoothing and was not visibly present in our build.
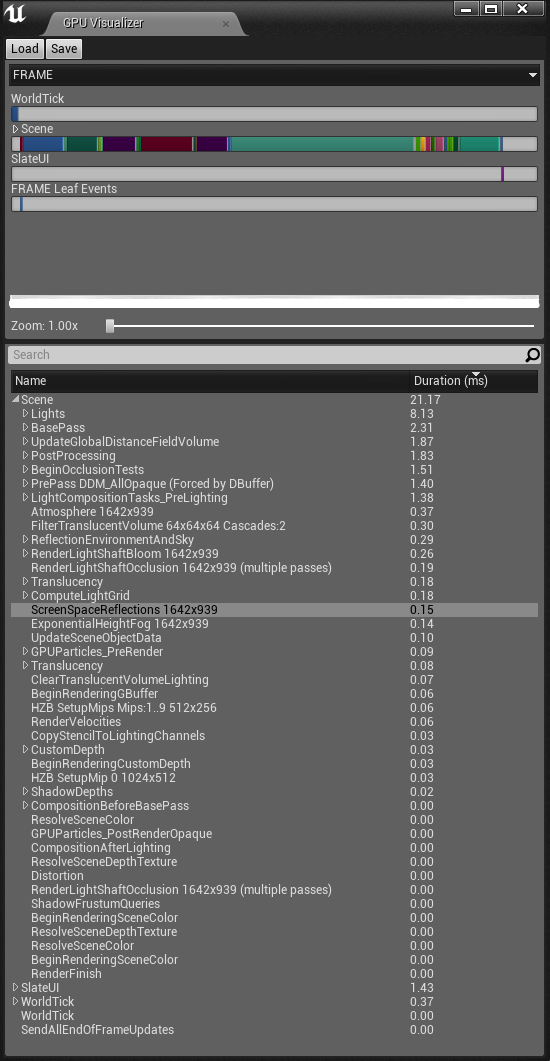
GPU Profiler after reducing translucency complexity
The next most important tool was the GPU profiler. This breaks down the processes the GPU runs for a single frame. We were instantly able to see that we had an issue with translucency, as it was taking around 20 ms. We were able to isolate the issue to our glass material on our ship and bubble particles, which was set to ‘surface forward shading'. This was the most expensive glass rendering method and so changing this to ‘surface translucency volume’ had very little impact on the visual fidelity and reduced our translucency pass to around 0.5 ms. Another smaller issue was the base pass, particularly the dynamic subcategory. This was caused by leaving our prefab buildings set to movable instead of static.
The next biggest issue was our lighting. We had a lot of lights, all of which were dynamic. We had little time to optimise our models for baked lighting and so would need to take every shortcut we could in order to get performance up. This included using the lightmap complexity visualiser to see where we needed to reduce our light count most. We also changed what point lights we could for spotlights as they are significantly more performant.
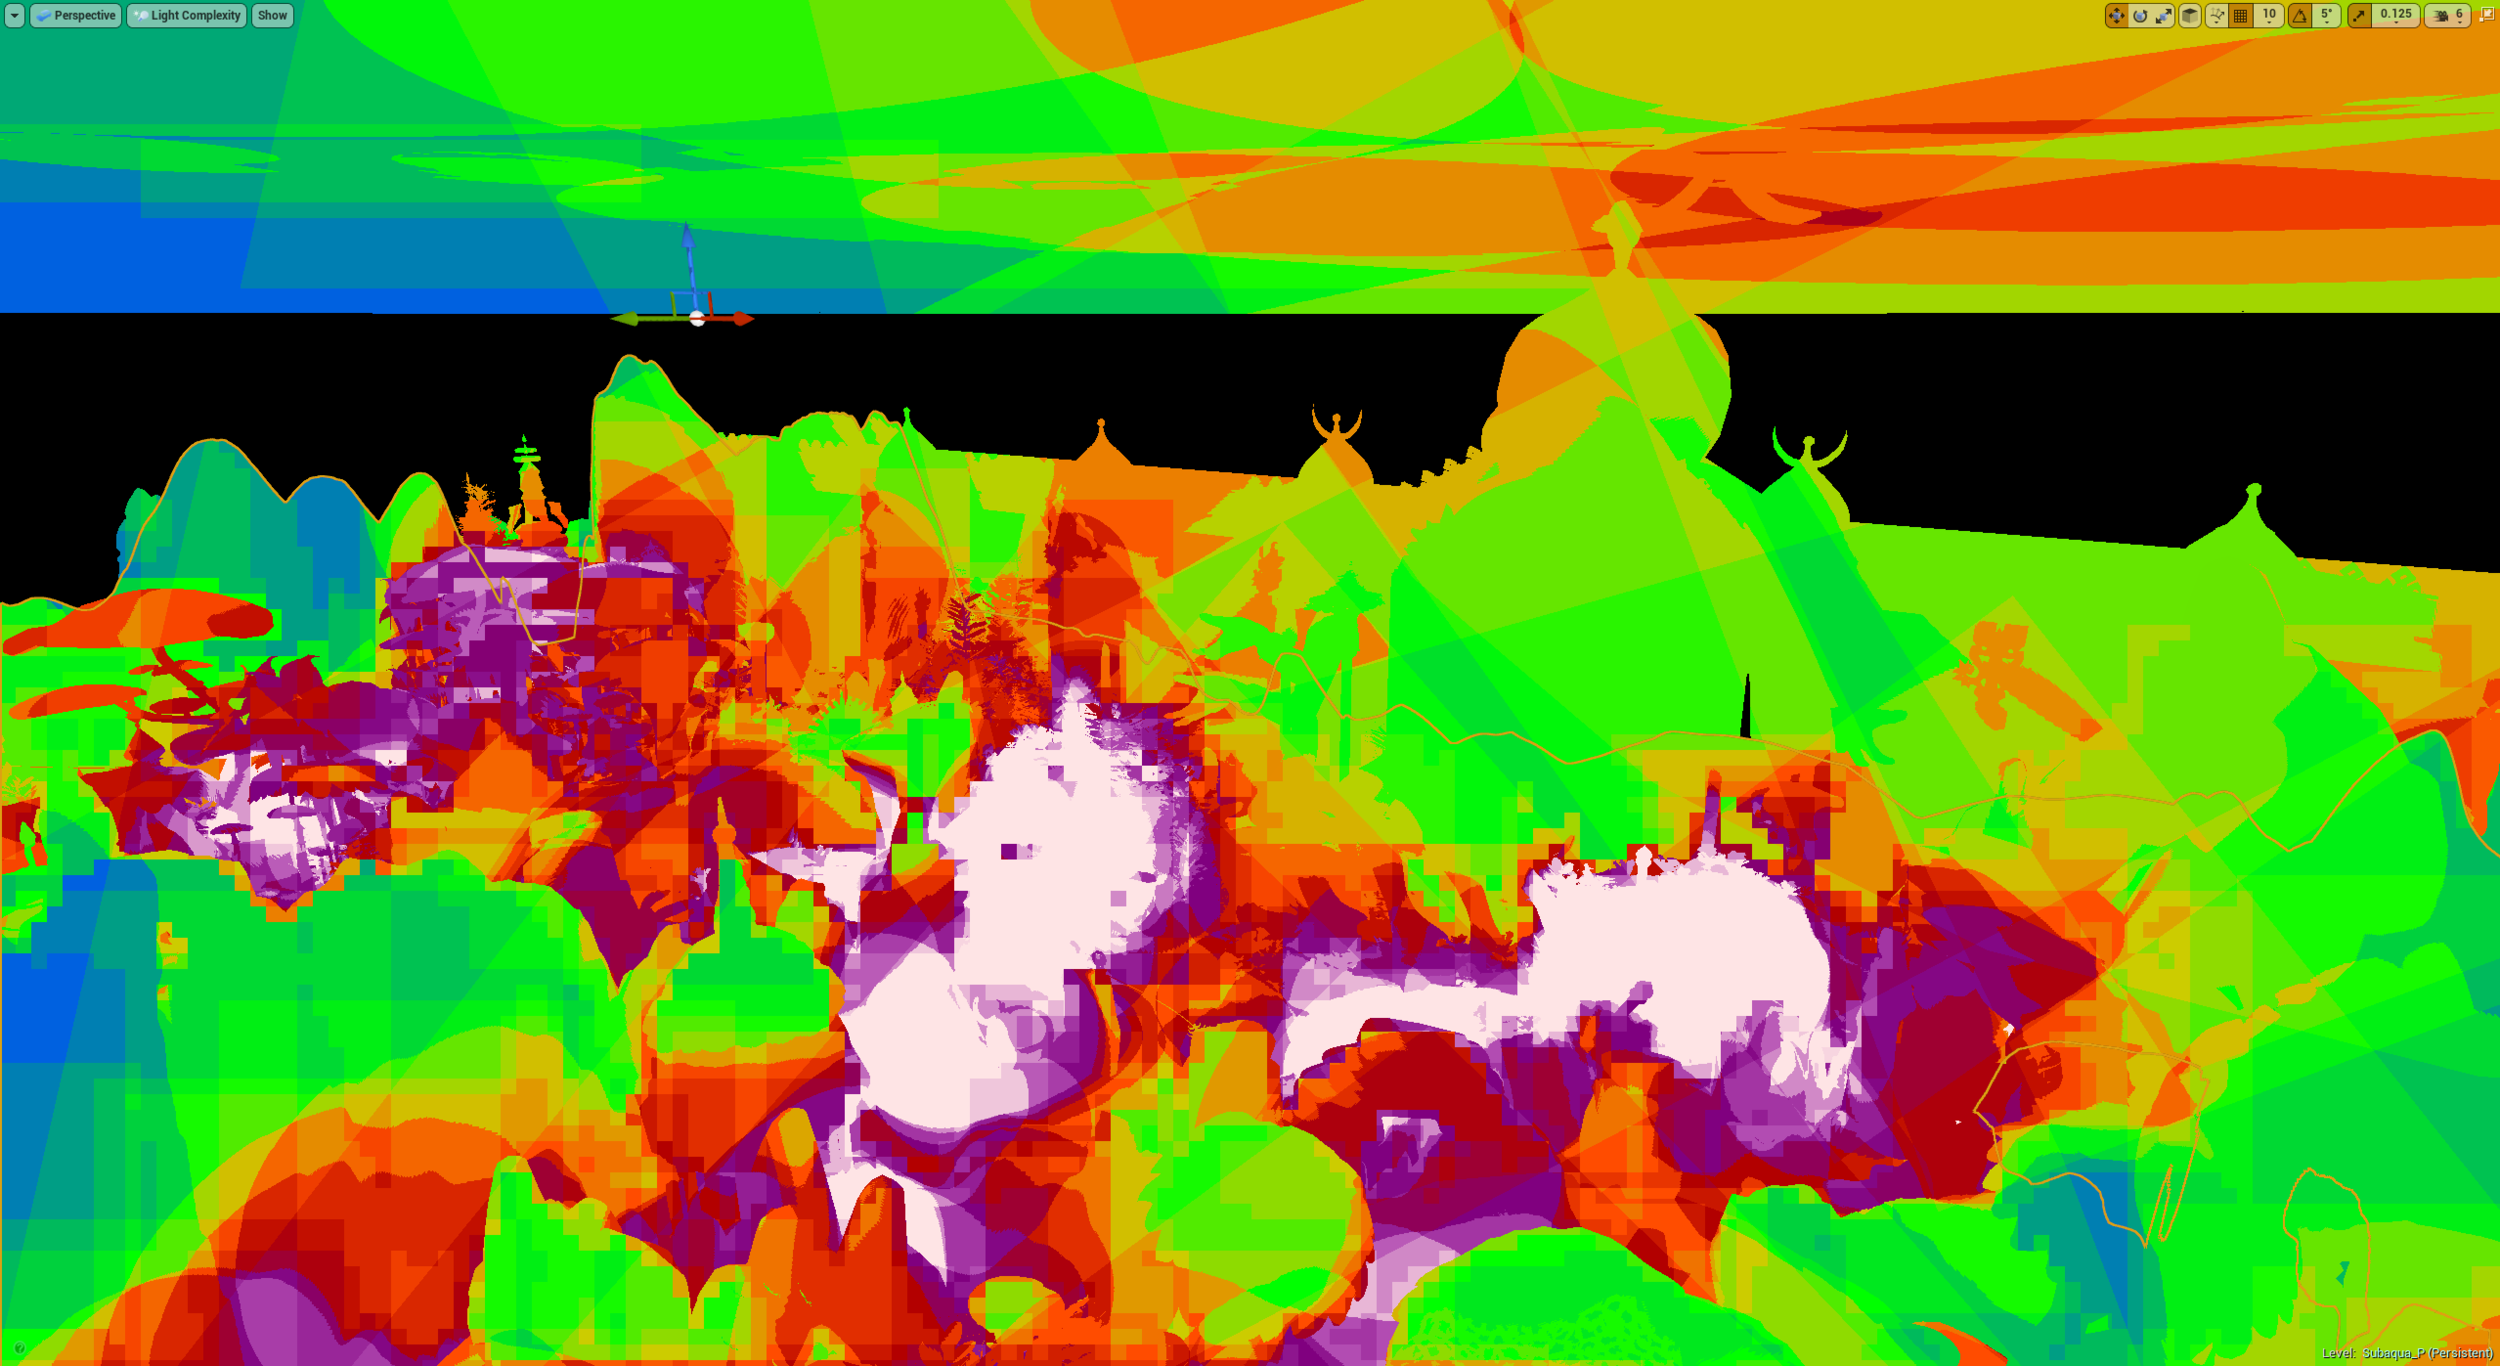
Light Complexity highlighting where our dynamic lighting was too dense

Statistics Window filtered by Sum Tris
It is challenging to see the performance impact that individual assets have on framerate, and so we made use of the statistics window to see what assets had the most potential for improvements. Filtering by the sum of triangles, it was most apparent that our ground plane was very high poly. however its performance impact was minimal, and we did not have any good solutions to improve it. After this, I worked my way down the list creating LODs using Unreals’ built-in tool, which worked fantastically for most models. Our groundplanes were also far too high, so had their poly counts reduced by resampling the ground texture map.
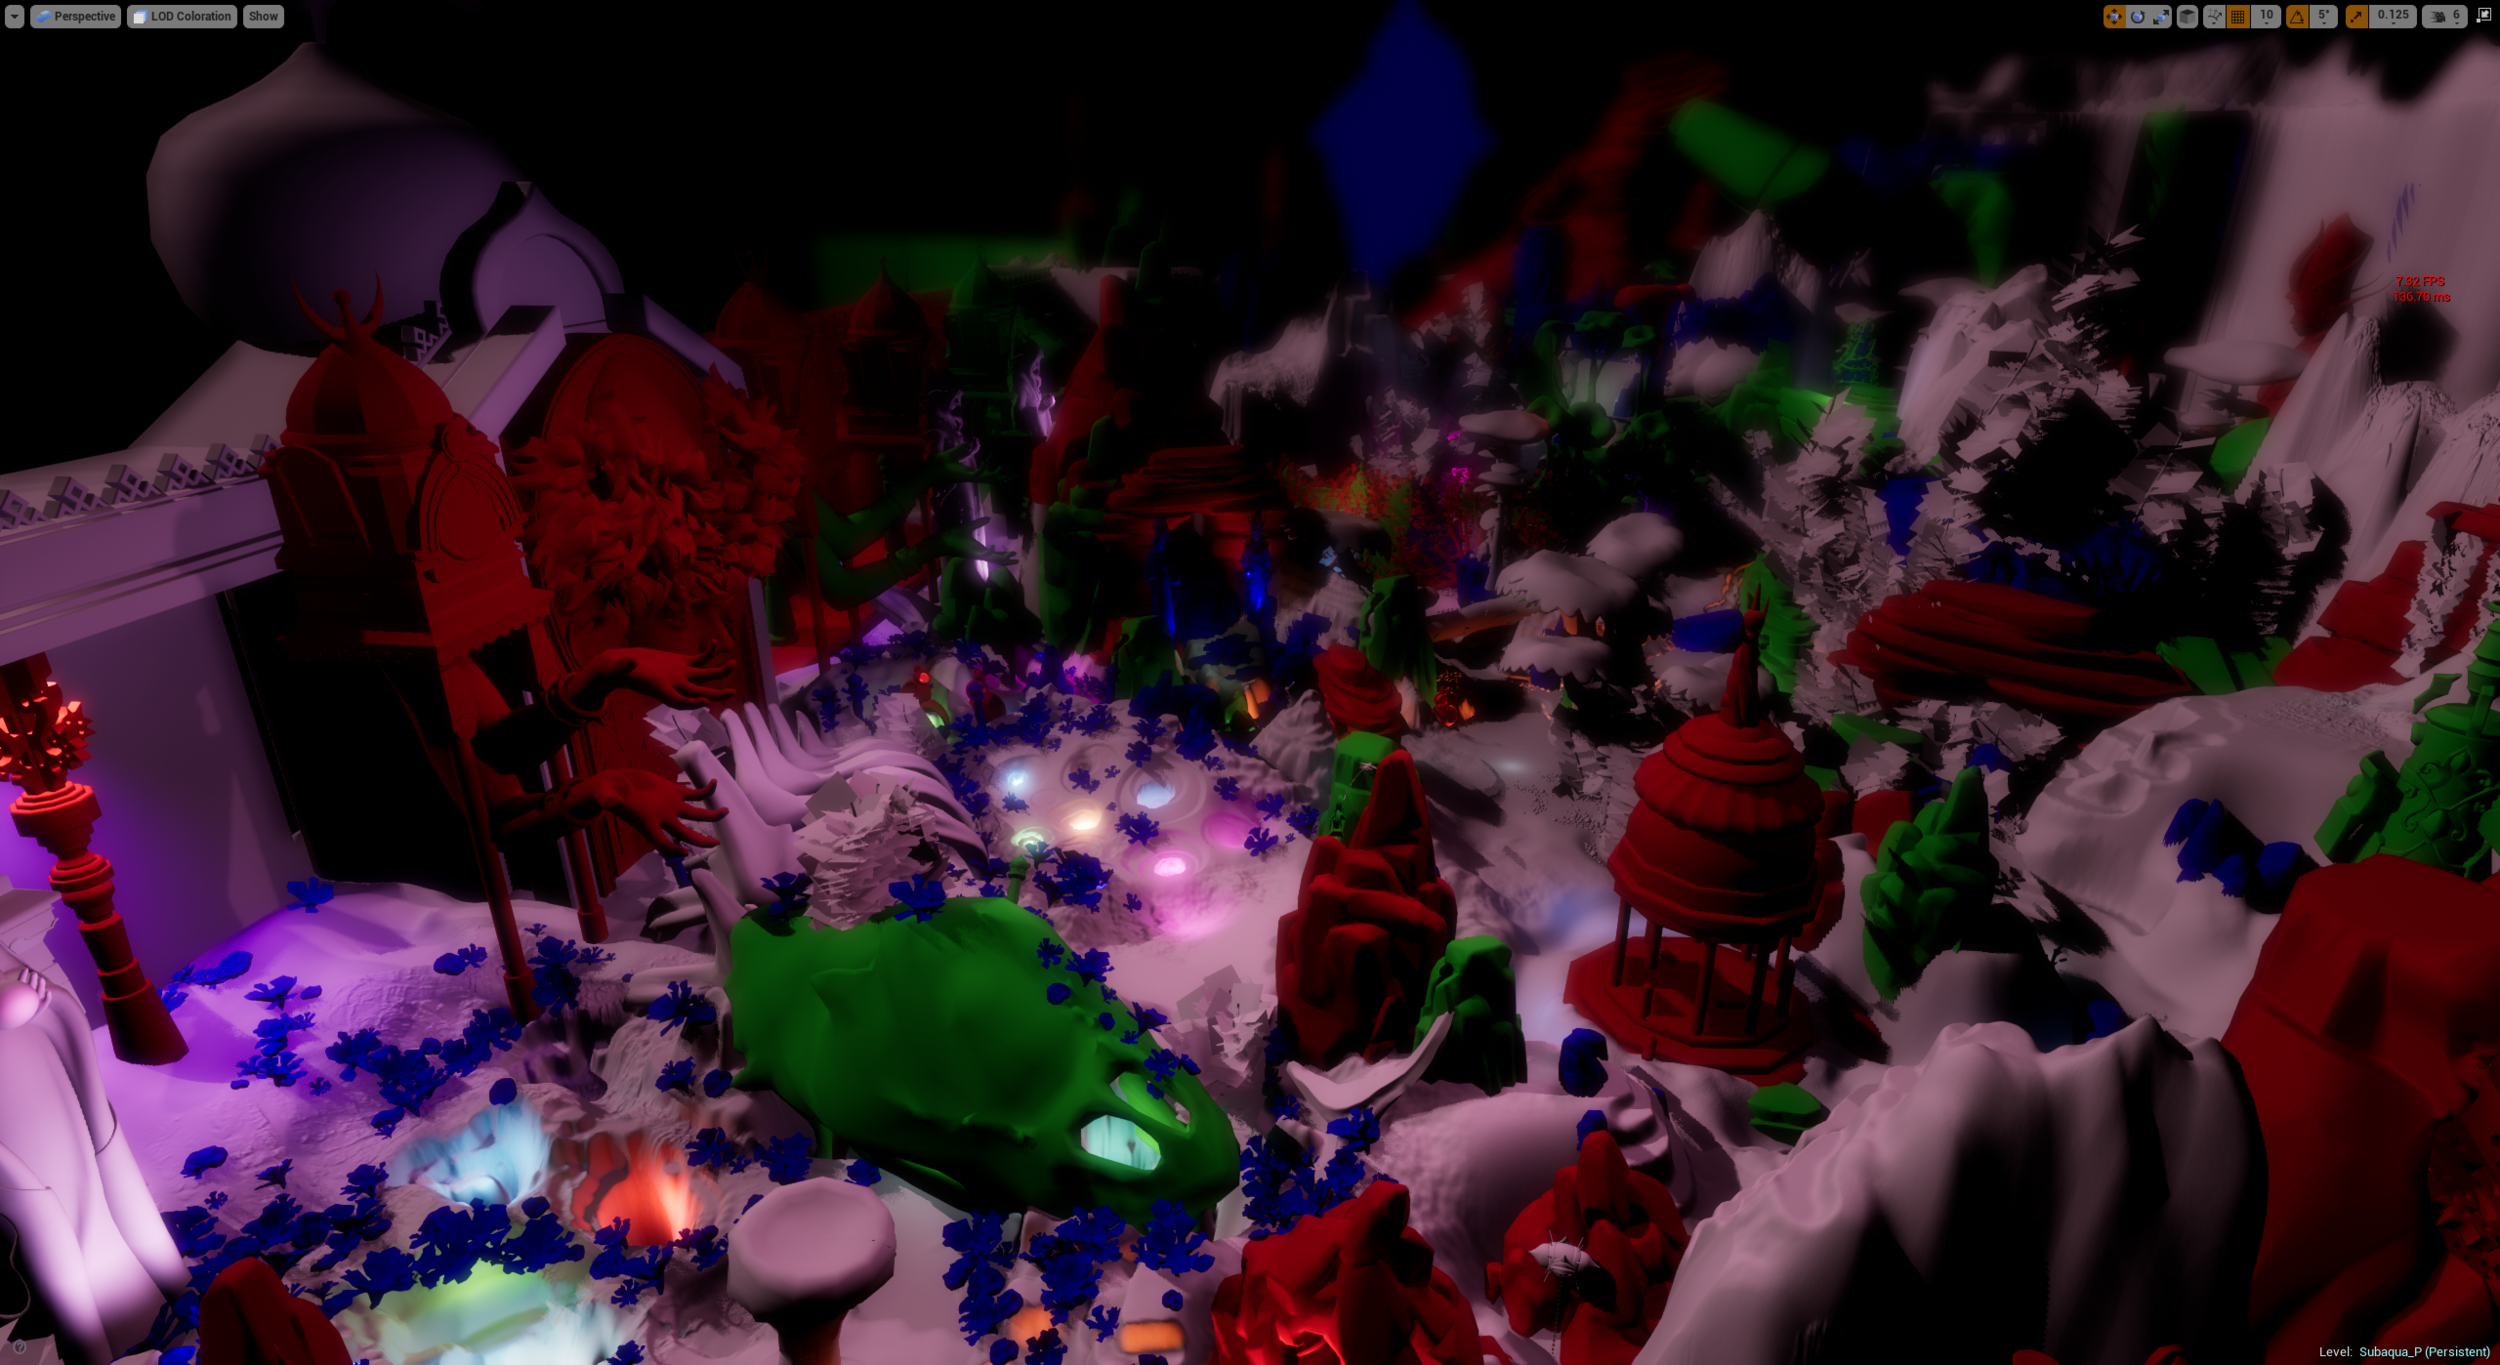
Mesh LOD visualiser

Shader Complexity showing overdraw due to transparent foliage
Finally, we utilised the shader complexity visualiser to see what effects had the biggest impact. The most notable was our foliage. We used cards with an alpha map for our leaves, however, it was clear we needed to be careful with this approach. Overdraw from overlapping transparent materials has a large performance impact. Our models were not too bad at this point, and we were more effectively able to take this into consideration with any additional foliage created.